HowTovSphere Monitoring with Grafana
vSphere Monitoring with TIG (Telegraf, InfluxDB, Grafana)
This blog post describes a solution for monitoring SDDC infrastructure using Telegraf, InfluxDB, and Grafana. This solution is based on Docker and displays graphs and metrics via Grafana. All metrics are described in the telegraf.conf file.
TL;DR: https://github.com/varmox/vsphere-monitoring.git
Prerequiries
- RHEL based Linux
- Docker & Docker Compose (or Podman with Docker Compose. In this tutorial we are using docker & docker compose) installed
- 3 internal IPs for telegraf, grafana and influxdb containers.
- Access to vSphere API (read-only is sufficient)
Environment Variables
In this tutorial we're using the following varibales, change them according to your setup:
- subnet 172.29.30.0/23
Filesystem structure:
/srv/tig
├── docker-compose.yml
└── telegraf.conf
Create Telegraf Config
Edit your telegraf.conf file with a editor of choice and paste overwrite your telegraf.conf File. This config skips tls certificate checking so can be used for self-signed certificates.
[agent]
  ## Default data collection interval for all inputs
  interval = "10s"
  ## Rounds collection interval to 'interval'
  ## ie, if interval="10s" then always collect on :00, :10, :20, etc.
  round_interval = true

  ## Telegraf will send metrics to outputs in batches of at most
  ## metric_batch_size metrics.
  ## This controls the size of writes that Telegraf sends to output plugins.
  metric_batch_size = 1000

  ## Maximum number of unwritten metrics per output.  Increasing this value
  ## allows for longer periods of output downtime without dropping metrics at the
  ## cost of higher maximum memory usage.
  metric_buffer_limit = 10000

  ## Collection jitter is used to jitter the collection by a random amount.
  ## Each plugin will sleep for a random time within jitter before collecting.
  ## This can be used to avoid many plugins querying things like sysfs at the
  ## same time, which can have a measurable effect on the system.
  collection_jitter = "0s"

  ## Default flushing interval for all outputs. Maximum flush_interval will be
  ## flush_interval + flush_jitter
  flush_interval = "10s"
  ## Jitter the flush interval by a random amount. This is primarily to avoid
  ## large write spikes for users running a large number of telegraf instances.
  ## ie, a jitter of 5s and interval 10s means flushes will happen every 10-15s
  flush_jitter = "0s"

  ## By default or when set to "0s", precision will be set to the same
  ## timestamp order as the collection interval, with the maximum being 1s.
  ##   ie, when interval = "10s", precision will be "1s"
  ##       when interval = "250ms", precision will be "1ms"
  ## Precision will NOT be used for service inputs. It is up to each individual
  ## service input to set the timestamp at the appropriate precision.
  ## Valid time units are "ns", "us" (or "µs"), "ms", "s".
  precision = ""

  ## Log at debug level.
  # debug = false
  ## Log only error level messages.
  # quiet = false

  ## Log target controls the destination for logs and can be one of "file",
  ## "stderr" or, on Windows, "eventlog".  When set to "file", the output file
  ## is determined by the "logfile" setting.
  # logtarget = "file"

  ## Name of the file to be logged to when using the "file" logtarget.  If set to
  ## the empty string then logs are written to stderr.
  # logfile = ""

  ## The logfile will be rotated after the time interval specified.  When set
  ## to 0 no time based rotation is performed.  Logs are rotated only when
  ## written to, if there is no log activity rotation may be delayed.
  # logfile_rotation_interval = "0d"

  ## The logfile will be rotated when it becomes larger than the specified
  ## size.  When set to 0 no size based rotation is performed.
  # logfile_rotation_max_size = "0MB"

  ## Maximum number of rotated archives to keep, any older logs are deleted.
  ## If set to -1, no archives are removed.
  # logfile_rotation_max_archives = 5

  ## Pick a timezone to use when logging or type 'local' for local time.
  ## Example: America/Chicago
  # log_with_timezone = ""

  ## Override default hostname, if empty use os.Hostname()
  hostname = ""
  ## If set to true, do no set the "host" tag in the telegraf agent.
  omit_hostname = false
[[outputs.influxdb_v2]]
  ## The URLs of the InfluxDB cluster nodes.
  ##
  ## Multiple URLs can be specified for a single cluster, only ONE of the
  ## urls will be written to each interval.
  ##   ex: urls = ["https://us-west-2-1.aws.cloud2.influxdata.com"]
  urls = ["http://172.29.31.3:8086"]

  ## Token for authentication.
  token = "sFYmFqizqj8oJyJxuMc7l4PEztLIPOWfe0Aae_QwQiJXA-obkKo_AHCEgXRwMCEXXyYsq6mqRayan3Ylh_Dy0g=="

  ## Organization is the name of the organization you wish to write to; must exist.
  organization = "sddc"

  ## Destination bucket to write into.
  bucket = "vsphere"

  ## The value of this tag will be used to determine the bucket.  If this
  ## tag is not set the 'bucket' option is used as the default.
  # bucket_tag = ""

  ## If true, the bucket tag will not be added to the metric.
  # exclude_bucket_tag = false

  ## Timeout for HTTP messages.
  # timeout = "5s"

  ## Additional HTTP headers
  # http_headers = {"X-Special-Header" = "Special-Value"}

  ## HTTP Proxy override, if unset values the standard proxy environment
  ## variables are consulted to determine which proxy, if any, should be used.
  # http_proxy = "http://corporate.proxy:3128"

  ## HTTP User-Agent
  # user_agent = "telegraf"

  ## Content-Encoding for write request body, can be set to "gzip" to
  ## compress body or "identity" to apply no encoding.
  # content_encoding = "gzip"

  ## Enable or disable uint support for writing uints influxdb 2.0.
  # influx_uint_support = false

  ## Optional TLS Config for use on HTTP connections.
  # tls_ca = "/etc/telegraf/ca.pem"
  # tls_cert = "/etc/telegraf/cert.pem"
  # tls_key = "/etc/telegraf/key.pem"
  ## Use TLS but skip chain & host verification
  # insecure_skip_verify = false
# Read metrics from VMware vCenter
[[inputs.vsphere]]
  ## List of vCenter URLs to be monitored. These three lines must be uncommented
  ## and edited for the plugin to work.
  vcenters = [ "https://vcenter-fqdn/sdk" ]
  username = "[email protected]"
  password = "secret"

  ## VMs
  ## Typical VM metrics (if omitted or empty, all metrics are collected)
  # vm_include = [ "/*/vm/**"] # Inventory path to VMs to collect (by default all are collected)
  # vm_exclude = [] # Inventory paths to exclude
  vm_metric_include = [
    "cpu.demand.average",
    "cpu.idle.summation",
    "cpu.latency.average",
    "cpu.readiness.average",
    "cpu.ready.summation",
    "cpu.run.summation",
    "cpu.usagemhz.average",
    "cpu.used.summation",
    "cpu.wait.summation",
    "mem.active.average",
    "mem.granted.average",
    "mem.latency.average",
    "mem.swapin.average",
    "mem.swapinRate.average",
    "mem.swapout.average",
    "mem.swapoutRate.average",
    "mem.usage.average",
    "mem.vmmemctl.average",
    "net.bytesRx.average",
    "net.bytesTx.average",
    "net.droppedRx.summation",
    "net.droppedTx.summation",
    "net.usage.average",
    "power.power.average",
    "virtualDisk.numberReadAveraged.average",
    "virtualDisk.numberWriteAveraged.average",
    "virtualDisk.read.average",
    "virtualDisk.readOIO.latest",
    "virtualDisk.throughput.usage.average",
    "virtualDisk.totalReadLatency.average",
    "virtualDisk.totalWriteLatency.average",
    "virtualDisk.write.average",
    "virtualDisk.writeOIO.latest",
    "sys.uptime.latest",
  ]
  # vm_metric_exclude = [] ## Nothing is excluded by default
  # vm_instances = true ## true by default

  ## Hosts
  ## Typical host metrics (if omitted or empty, all metrics are collected)
  # host_include = [ "/*/host/**"] # Inventory path to hosts to collect (by default all are collected)
  # host_exclude [] # Inventory paths to exclude
  host_metric_include = [
    "cpu.coreUtilization.average",
    "cpu.costop.summation",
    "cpu.demand.average",
    "cpu.idle.summation",
    "cpu.latency.average",
    "cpu.readiness.average",
    "cpu.ready.summation",
    "cpu.swapwait.summation",
    "cpu.usage.average",
    "cpu.usagemhz.average",
    "cpu.used.summation",
    "cpu.utilization.average",
    "cpu.wait.summation",
    "disk.deviceReadLatency.average",
    "disk.deviceWriteLatency.average",
    "disk.kernelReadLatency.average",
    "disk.kernelWriteLatency.average",
    "disk.numberReadAveraged.average",
    "disk.numberWriteAveraged.average",
    "disk.read.average",
    "disk.totalReadLatency.average",
    "disk.totalWriteLatency.average",
    "disk.write.average",
    "mem.active.average",
    "mem.latency.average",
    "mem.state.latest",
    "mem.swapin.average",
    "mem.swapinRate.average",
    "mem.swapout.average",
    "mem.swapoutRate.average",
    "mem.totalCapacity.average",
    "mem.usage.average",
    "mem.vmmemctl.average",
    "net.bytesRx.average",
    "net.bytesTx.average",
    "net.droppedRx.summation",
    "net.droppedTx.summation",
    "net.errorsRx.summation",
    "net.errorsTx.summation",
    "net.usage.average",
    "power.power.average",
    "storageAdapter.numberReadAveraged.average",
    "storageAdapter.numberWriteAveraged.average",
    "storageAdapter.read.average",
    "storageAdapter.write.average",
    "sys.uptime.latest",
  ]
    ## Collect IP addresses? Valid values are "ipv4" and "ipv6"
  # ip_addresses = ["ipv6", "ipv4" ]

  # host_metric_exclude = [] ## Nothing excluded by default
  # host_instances = true ## true by default


  ## Clusters
  # cluster_include = [ "/*/host/**"] # Inventory path to clusters to collect (by default all are collected)
  # cluster_exclude = [] # Inventory paths to exclude
  # cluster_metric_include = [] ## if omitted or empty, all metrics are collected
  # cluster_metric_exclude = [] ## Nothing excluded by default
  # cluster_instances = false ## false by default

  ## Datastores
  # datastore_include = [ "/*/datastore/**"] # Inventory path to datastores to collect (by default all are collected)
  # datastore_exclude = [] # Inventory paths to exclude
  # datastore_metric_include = [] ## if omitted or empty, all metrics are collected
  # datastore_metric_exclude = [] ## Nothing excluded by default
  # datastore_instances = false ## false by default

  ## Datacenters
  # datacenter_include = [ "/*/host/**"] # Inventory path to clusters to collect (by default all are collected)
  # datacenter_exclude = [] # Inventory paths to exclude
  datacenter_metric_include = [] ## if omitted or empty, all metrics are collected
  datacenter_metric_exclude = [ "*" ] ## Datacenters are not collected by default.
  # datacenter_instances = false ## false by default

  ## Plugin Settings
  ## separator character to use for measurement and field names (default: "_")
  # separator = "_"

  ## number of objects to retrieve per query for realtime resources (vms and hosts)
  ## set to 64 for vCenter 5.5 and 6.0 (default: 256)
  # max_query_objects = 256

  ## number of metrics to retrieve per query for non-realtime resources (clusters and datastores)
  ## set to 64 for vCenter 5.5 and 6.0 (default: 256)
  # max_query_metrics = 256

  ## number of go routines to use for collection and discovery of objects and metrics
  # collect_concurrency = 1
  # discover_concurrency = 1

  ## the interval before (re)discovering objects subject to metrics collection (default: 300s)
  # object_discovery_interval = "300s"

  ## timeout applies to any of the api request made to vcenter
  # timeout = "60s"

  ## When set to true, all samples are sent as integers. This makes the output
  ## data types backwards compatible with Telegraf 1.9 or lower. Normally all
  ## samples from vCenter, with the exception of percentages, are integer
  ## values, but under some conditions, some averaging takes place internally in
  ## the plugin. Setting this flag to "false" will send values as floats to
  ## preserve the full precision when averaging takes place.
  # use_int_samples = true

  ## Custom attributes from vCenter can be very useful for queries in order to slice the
  ## metrics along different dimension and for forming ad-hoc relationships. They are disabled
  ## by default, since they can add a considerable amount of tags to the resulting metrics. To
  ## enable, simply set custom_attribute_exclude to [] (empty set) and use custom_attribute_include
  ## to select the attributes you want to include.
  ## By default, since they can add a considerable amount of tags to the resulting metrics. To
  ## enable, simply set custom_attribute_exclude to [] (empty set) and use custom_attribute_include
  ## to select the attributes you want to include.
  # custom_attribute_include = []
  # custom_attribute_exclude = ["*"]

  ## The number of vSphere 5 minute metric collection cycles to look back for non-realtime metrics. In
  ## some versions (6.7, 7.0 and possible more), certain metrics, such as cluster metrics, may be reported
  ## with a significant delay (>30min). If this happens, try increasing this number. Please note that increasing
  ## it too much may cause performance issues.
  # metric_lookback = 3

  ## Optional SSL Config
  # ssl_ca = "/path/to/cafile"
  # ssl_cert = "/path/to/certfile"
  # ssl_key = "/path/to/keyfile"
  ## Use SSL but skip chain & host verification
  insecure_skip_verify = true

  ## The Historical Interval value must match EXACTLY the interval in the daily
  # "Interval Duration" found on the VCenter server under Configure > General > Statistics > Statistic intervals
  # historical_interval = "5m"
Container Setup
Use the following docker compose file to start your containers. This solution uses ipvlan to assign each container an IPv4 Address. You don't have to assign the IPs to your OSes NIC.
Change the passwords and secrets to your needs.
version: '3.6'

networks:
  ipvlan0:
    driver: ipvlan
    driver_opts:
      parent: ens192


services:
  telegraf:
    image: telegraf
    container_name: telegraf
    restart: always
    volumes:
    - ./telegraf.conf:/etc/telegraf/telegraf.conf:ro
    depends_on:
      - influxdb
    links:
      - influxdb
    ports:
    - '8125:8125'
    networks:
      ipvlan0:
        ipv4_address: 172.29.31.2

  influxdb:
    image: influxdb:2.6-alpine
    container_name: influxdb
    restart: always
    environment:
      - INFLUXDB_DB=influx
      - INFLUXDB_ADMIN_USER=admin
      - INFLUXDB_ADMIN_PASSWORD=admin
    networks:
      ipvlan0:
        ipv4_address: 172.29.31.3

    ports:
      - '8086:8086'
    volumes:
      - influxdb_data:/var/lib/influxdb

  grafana:
    image: grafana/grafana
    container_name: grafana-server
    restart: always
    depends_on:
      - influxdb
    environment:
      - GF_SECURITY_ADMIN_USER=admin
      - GF_SECURITY_ADMIN_PASSWORD=admin
      - GF_INSTALL_PLUGINS=
    links:
      - influxdb
    networks:
      ipvlan0:
        ipv4_address: 172.29.31.4
    ports:
      - '3000:3000'
    volumes:
      - grafana_data:/var/lib/grafana

volumes:
  grafana_data: {}
  influxdb_data: {}
Start Containers
In the directory where the docker compose file is located:
docker compose up -d
Check Containers
docker ps -a
The containers should all have a running state.
Create TIG Config
Head to your influxDB container ip with port 8086. In my case it is '172.29.31.3:8086' With help of the webinterface create your buckets according to the naming in your "telegraf.conf" file.
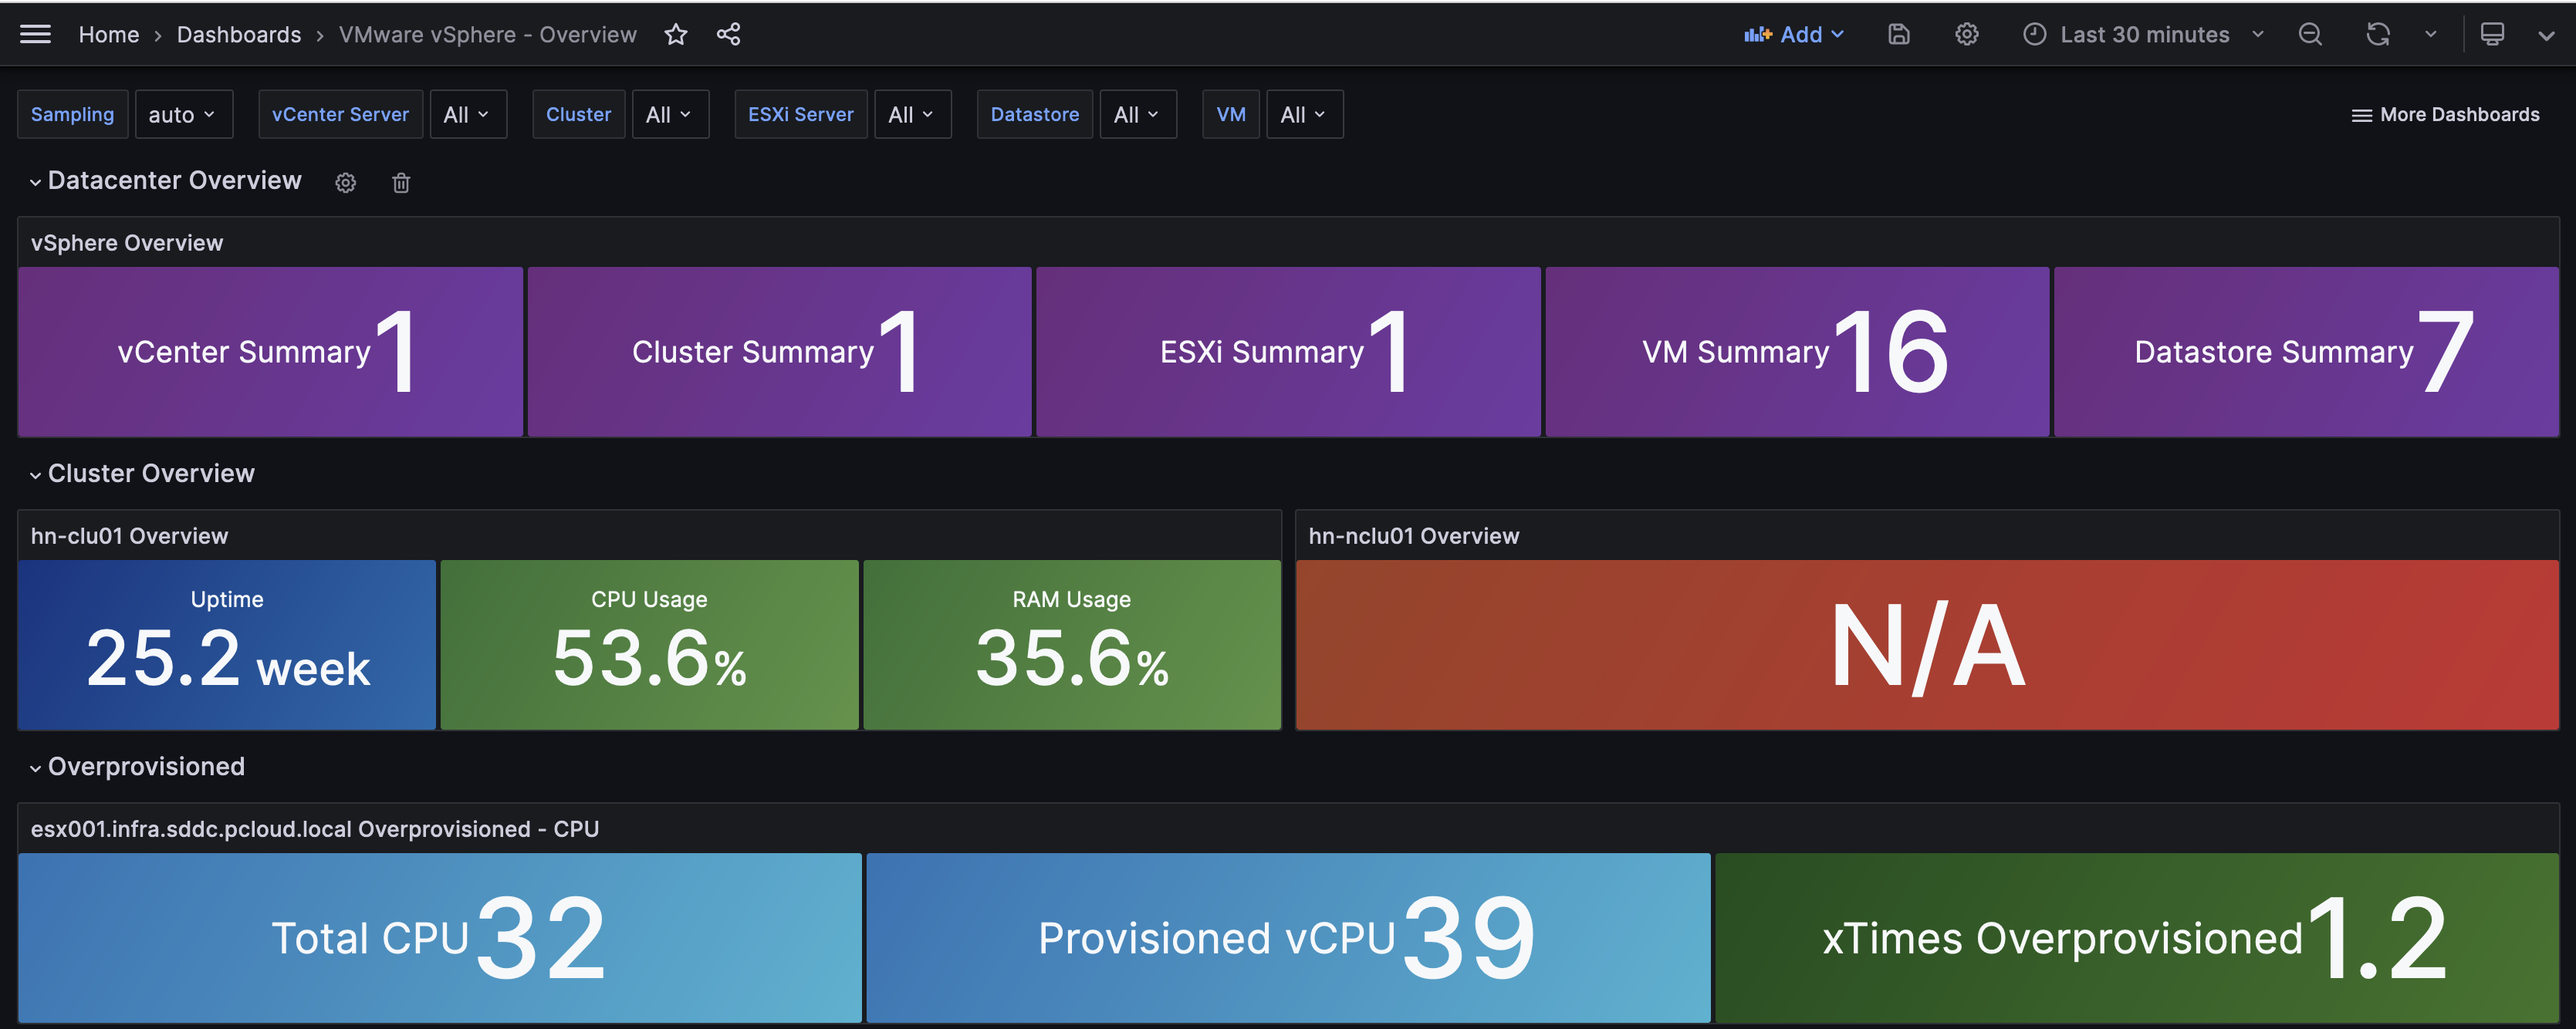
Import Grafana Dashboards
Access your grafana dashboard at your IP with port 3000 (in my case https://172.29.31.4:3000)
The grafana dashboards can be access via github: https://github.com/jorgedlcruz/vmware-grafana/tree/master (Cudos to Jorge de la Cruz)
Import the grafana dashboards:
- Click Dashboards in the left-side menu.
- Click New and select Import in the dropdown menu.
- Paste dashboard JSON text directly into the text area